Romalee Amolic talks about her 2018-19 Te Pūnaha Matatini Summer Internship with AgResearch where she worked on a project to enhance social network analyses of biosecurity information in the New Zealand tourism industry, so that such analyses can be conducted faster and more effectively in the future.
Social Network Analysis (SNA) is a powerful data analysis technique which often helps in identifying hidden relationships and other critical information in a communication network. Data for an SNA can be collected from various sources which may result in extensive pre-processing and cleaning time as compared to the time needed for actual network analysis. Hence, this project aimed to use data carpentry to streamline the use of social research data (e.g. collected through surveys) to be able to conduct social network analyses quicker and more effectively in the future.
Better Border Biosecurity case study
The Better Border Biosecurity project, a multi-partner, cooperative science collaboration which analyses the exchange of biosecurity information in the New Zealand tourism industry, is used as a case study to develop and test methods which streamline the SNA process. The data for this project includes 154 responses from tourism providers across New Zealand who named up to 3 sources from whom they seek or receive biosecurity information. Information about the location and role of the respondents was collected. Some additional questions were also included in the survey such as the form and frequency of communication, the usefulness of information and the trust between parties.
This information was then used to perform Social Network Analysis in Gephi – a powerful interactive social network analysis tool. However, the survey data had to be first converted into a format fit for network analysis. The conventional approach for cleaning the data is discussed below.
Conventional approach
The survey responses were collected in Excel sheets. The data pre-processing and cleaning was done manually using Excel.
Problems with the conventional approach
- It involved dealing with the data manually which was an extremely time-consuming process and needed about 1-3 weeks depending on the complexity of the data.
- The process was prone to human errors which reduced the potential of the data.
- It required skilled labour for an extended amount of time and hence, increased the costs involved.
- It led to data inconsistencies.
Hence, taking all these problems into consideration, a generic automated process was developed to clean the data as discussed in the following sections.
Data Cleaning and Pre-processing
In a network, each node represents a unique identity. Hence, the most important task in cleaning the data was to recognise and remove inconsistencies in the names which occurred due to the textual nature of responses. The following techniques were used to clean the data in Python:
- Initially, all the names were made lowercase for the analysis.
- Special characters were removed.
- Rows containing missing or no information were removed.
- Trailing or unnecessary white spaces were removed.
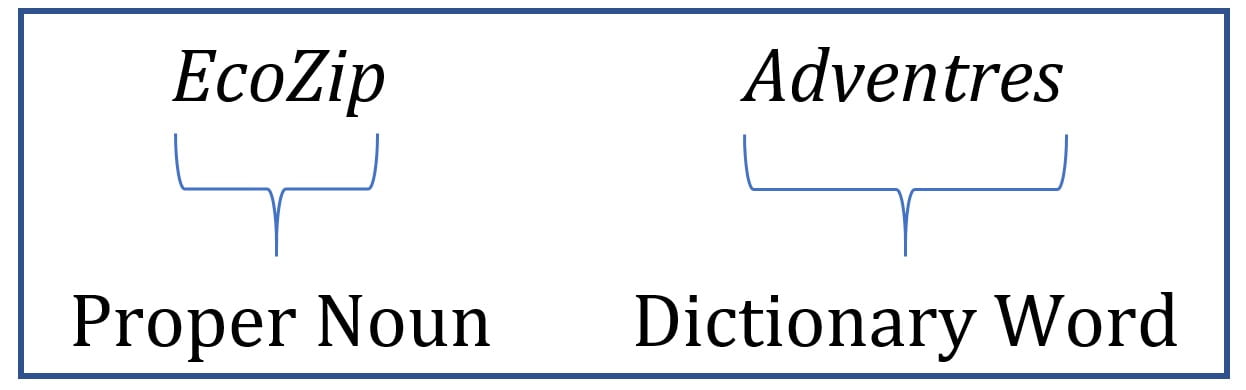
- Incorrect spellings were identified and removed using a spellchecker. The challenge here was to differentiate between the proper nouns (such as ‘EcoZip’) and dictionary words (such as ‘Adventures’). For example, an entity name ‘EcoZip Adventures’ was misspelled as ‘EcoZip Adventres’. A conventional spell checker would consider ‘EcoZip’ as a spelling error along with ‘Adventres’ as both the words are not found in the dictionary. Hence, a solution was developed to distinguish the proper nouns from actual dictionary words in entity names and correct spelling errors in the data.
- A custom algorithm was developed to identify abbreviations in the text and replace it with the full name. e.g. ‘DOC’ was identified as ‘Department of Conservation’.
- Several names which were written similarly but were however, the same entity, were identified and merged. This is the most significant part of the process or the most “satisfying” part, as a user described it. An example is shown below:

- All the names in the network were also compared pairwise to further remove any inconsistencies and generate a list of consistent and unique names involved in the biosecurity information exchange.
This cleaning process reduced the entities from 319 (including inconsistencies) to 139 consistent and unique entities (nodes) in the network with 335 relationships (edges) between them which were then used to generate visualisations.
Social Network Analysis
Directed maps were generated using Gephi which were then further analysed. An anonymised example of one of the social network maps generated is shown below:
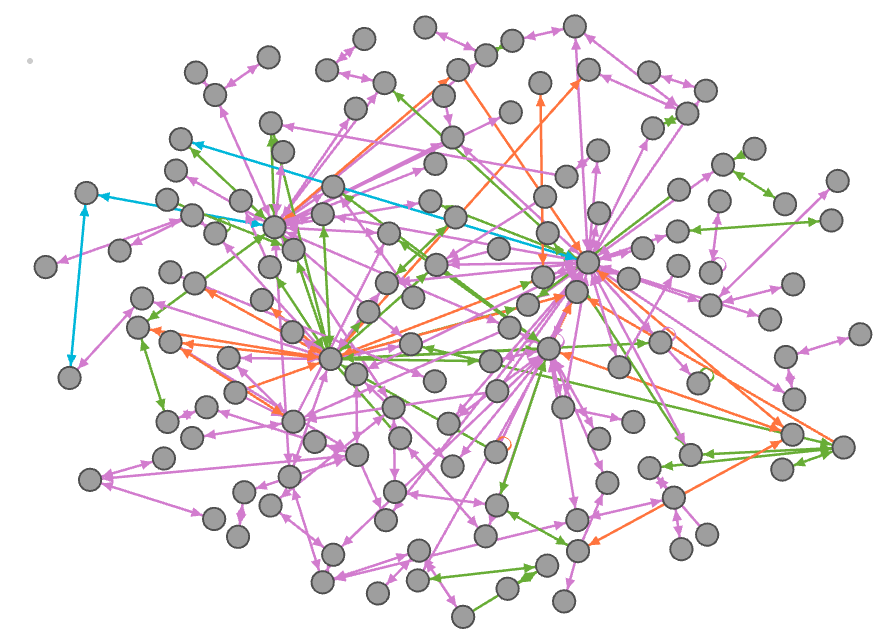
An example of anonymised social network map generated using Gephi.
The information obtained through this network analysis can now be used by biosecurity providers to better target information exchange within the New Zealand tourism industry.
Achievements
- This application significantly reduced the time (from 1-3 weeks to a few hours or minutes) in cleaning and pre-processing the data before analysis.
- As a result, the costs involved in the conventional extensive processes, which involved a lot of manual effort, were also reduced.
- The new streamlined process almost eliminated the human errors involved in the manual inspection of data.
Conclusion
Hence, through this case study, an application was developed, which streamlines and automates all the steps starting from loading and cleaning the data up to the generation of data sheets to be used in the SNA. Although, this is currently a Python application, the development of a GUI based interactive SNA application design is currently under consideration.
I would like to acknowledge Helen Percy, my industry supervisor and Penny Payne, the social scientist at AgResearch for their invaluable support during this project.
Author
Romalee Amolic is a Master of Applied Data Science student at the University of Canterbury. In February 2018, she completed her summer internship with AgResearch, Hamilton. She thoroughly enjoyed her internship project which involved streamlining and increasing the efficiency of the data cleaning and network map generation processes at AgResearch. She is passionate about harnessing the power of data analytics to improve the lives of people. She eagerly looks forward to applying the skills learnt, in fulfilling her aspiration of becoming a data scientist.

Romalee (centre) with Helen Percy, her industry supervisor (right), and Penny Payne, the social scientist at AgResearch (left).